
tennis
The Favorite-Longshot Bias in Tennis: What 16,177 Bets Show
A model that claims a 20-percentage-point edge sounds like a great bet. Our own backtest says the opposite: the bigger the claimed edge, the worse it actually performed.
What we tested
Every bet placed on raw Elo-implied probability against real closing odds, 2020 through 2025 — 16,177 bets in total, grouped into four bands by how large the claimed edge was. Edge here means the gap between the model’s estimated win probability and what the market’s no-vig price implied.
If bigger edges were simply “more confident, more correct” versions of the same signal, ROI should hold steady or improve as the edge band gets larger. That is not what happened.
The result
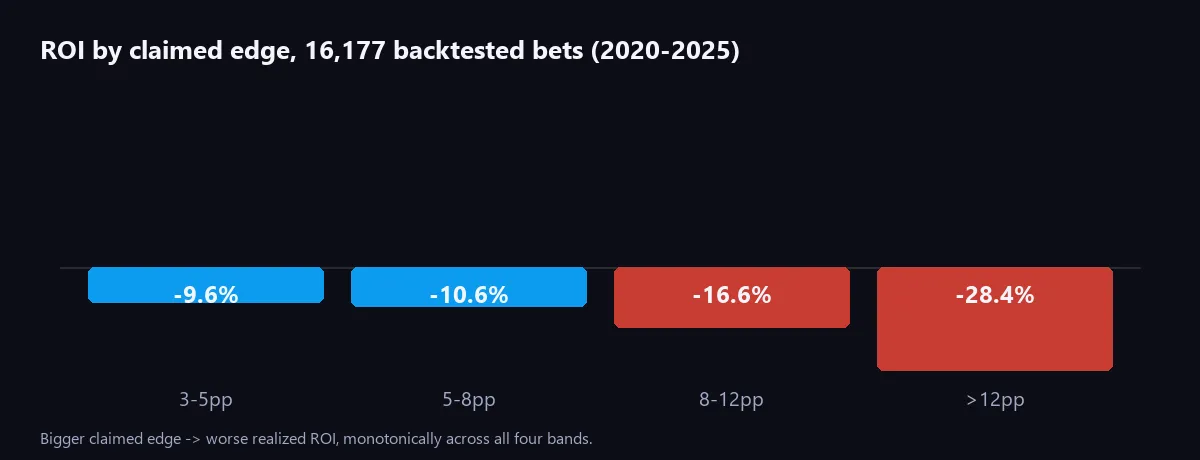
| Claimed edge | Bets | ROI |
|---|---|---|
| 3-5pp | 3,247 | -9.6% |
| 5-8pp | 4,019 | -10.6% |
| 8-12pp | 3,936 | -16.6% |
| >12pp | 4,975 | -28.4% |
The relationship is monotonic across all four bands — not one noisy outlier band, but a clean, worsening trend as claimed edge increases. That pattern is much harder to explain away as sampling noise than a single bad band would be.
Why a bigger claimed edge would predict a worse bet, not a better one
The explanation isn’t that underdogs are cursed. It’s about where estimation error concentrates. A genuinely huge edge claim can come from two places: a real, rare market mispricing, or a modeling error that overstates how confident the model should be. Both produce the same output — a large number — and there’s no way to tell them apart from the edge figure alone.
Large claimed edges are disproportionately likely to be the second kind. A model is more likely to be badly wrong about an unusual, hard-to-price matchup (an injury-affected player, a huge ranking mismatch, thin data on one side) than about a well-understood, closely-matched one — and those are exactly the situations that produce the biggest edge numbers. The market, meanwhile, has already absorbed the obvious stuff; a price that looks 20 points off to a model is more often the model missing something than the market missing something.
What this doesn’t tell us
This is a backtest on raw Elo-implied probability across a large historical dataset — not a test of the live pick-selection pipeline, which adds a probability-estimation step, a calibration correction, and selective posting on top of the raw rating gap. On our own 165 live picks measured so far, the same relationship isn’t statistically detectable (correlation +0.005, 95% confidence interval [-0.156, +0.166]) — which is what you’d expect at that sample size even if the effect is real, not evidence the effect doesn’t apply to live picks.
The live data does point the same direction it should, though: picks in the 3-4pp edge band hit at 82.1% over 28 picks, for +12.33 units — the profitable end of exactly the band the backtest also flagged as least distorted.
What we changed because of this
Nothing to the minimum edge required — the backtest’s profitable band is the lower one, so raising the floor would cut the part that’s working. Instead, an upper cap (rejecting or capping claimed edges above roughly 12pp as implausible rather than treating them as extra-good opportunities) is being run in shadow mode against live picks before it’s switched on for real. A detector for implausible edges already exists and had fired 152 times before this analysis — those blocked candidates were never logged, which is exactly why they couldn’t be evaluated until logging was added.
The honest limitation
This finding held up cleanly on a large sample, but it’s about a raw, uncorrected rating gap — not a claim that every large-edge bet from every model is bad. A well-calibrated model with a tighter estimation process might not show the same inversion at all. What it does argue for, in any model: treat an unusually large edge claim as a reason to double-check the inputs, not as a reason for extra confidence.
Related: what value betting actually means and why flat staking outperformed scaled sizing on the same underlying question of trusting a model’s own confidence.
Frequently asked questions
- What is the favorite-longshot bias in betting?
- It's a well-documented pattern where bets on big underdogs tend to be overpriced relative to their real chances, and bets on strong favorites tend to be underpriced. In our data, a related pattern shows up on the edge side: the bigger the edge a model claims, the less trustworthy that claim tends to be.
- Does a bigger edge always mean a worse bet?
- Not necessarily — but our backtest across 16,177 bets found a clean, monotonic pattern: realized ROI got worse as claimed edge increased, from -9.6% in the 3-5pp band to -28.4% for edges above 12pp. That's a strong reason to treat very large edge claims with more, not less, suspicion.
- Does this mean ServedBets lowered its minimum edge threshold?
- No — the backtest shows the profitable band is the lower one, not that lower is always better. The response was adding an upper edge cap under evaluation, not raising the minimum edge required to post a pick.
- Is this backtest the same as ServedBets' live results?
- No, and that distinction matters. The backtest ran on raw Elo across a large historical dataset, not the live pipeline (which adds a probability-estimation step, a calibration correction, and pick selection). On the smaller set of live picks measured so far, the same inversion effect isn't statistically detectable yet — expected, given the much smaller sample.