
tennis
What 244 Tracked Picks Reveal About a Value-Betting Model
Most track records show you a number and ask you to trust it. Here’s what 244 tracked picks actually look like when you check the parts most records leave out.
The raw record
As of September 6, 2026: 244 picks tracked, 203 settled, 3 still open, 38 voided (no result to grade — stake refunded, not counted as a loss). 125 wins, 78 losses. Net result: +26.48 units. ROI: +13.0%.
A correction is part of this record, not hidden from it: a settlement audit found one pick from August 25 had been recorded as a loss when the match actually ended in a retirement, which the current rule always voids regardless of score — the API’s own score data was revised after the original settlement. That single fix, plus 18 older picks (from June and July) that turned out to have no measurable market price behind their displayed edge — a bug, not a judgment call, see below — accounts for the gap between this figure and the one previously published here.
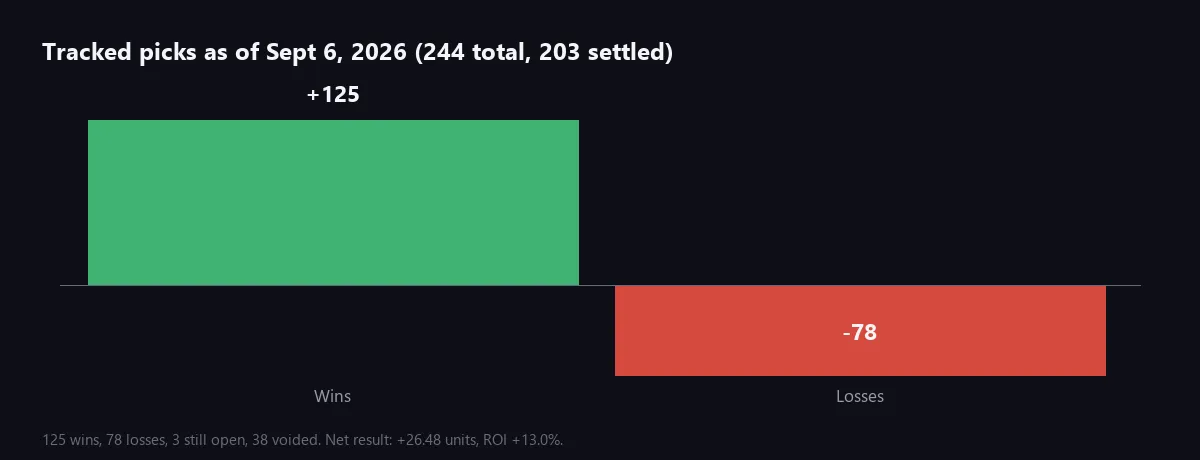
Those numbers update continuously as picks settle — see the results page for the current figures, not a snapshot frozen at publication. What’s below isn’t the headline record; it’s what happens when you check the parts of it that are usually skipped.
Updated September 6, 2026: the headline record, CLV split, and surface segments above are refreshed to the current numbers, including a retroactive correction (see above). The variance check and calibration comparison below are from the original September 1 analysis and haven’t been rerun against the newer data yet — flagged here rather than left looking as current as the rest of this update.
What actually held up under a second look
Closing line value, independent of outcome. On the subset of picks with a measured closing price (n=59), average CLV came in at +2.58 percentage points — positive, and directionally consistent with the win-rate result, which matters because CLV doesn’t care who won. Split by result: winning picks averaged +5.42pp CLV (n=41), losing picks averaged -4.21pp (n=17). That gap — CLV tracking outcome even though it’s calculated independently of outcome — is a stronger signal than either number alone.
A losing week that turned out to be noise, not a defect. A specific 7-day stretch produced 15 wins from 27 picks, worse than the surrounding run. Checked against what the underlying win rate alone would produce by chance: a stretch that weak or weaker happens in roughly a third of 27-pick windows at this hit rate, purely from variance (z = -0.58, not significant). The same week’s CLV was actually higher than the period before it (+4.09pp vs +2.83pp) — the market was still confirming the picks; only the short-term results landed differently, which is exactly what variance looks like from the inside.
Calibration holds at current sample size. Checked across three confidence bands (50-60%, 60-70%, 70%+), predicted win rate and actual win rate stay within each band’s confidence interval — no band shows a statistically detectable miscalibration yet. A cross-validated comparison against several alternative calibration approaches found none beat the existing method out of sample; the one that looked most promising in theory (isotonic regression) performed worst of all, losing to the baseline in 100% of validation runs — a reminder that a method fitting training data better doesn’t mean it generalizes better.
What hasn’t cleared the bar yet
Segment splits. Individual breakdowns — by surface, by market, by tournament tier — mostly don’t have enough picks yet for their own confidence interval to exclude zero, even where the raw numbers look different from each other. Clay currently shows the weakest raw win rate of the three surfaces (45 picks, 57.8% hit rate, +1.74 units — positive, but clearly behind hard’s 63.1%/130 picks and grass’s 60.7%/28 picks) — worth watching, not yet a reason to filter clay picks, because the sample is still small enough that this could easily reverse.
A specific hypothesis around head-to-head history. A meaningful-looking split showed up between picks with and without head-to-head history between the two players — see the full breakdown — but it was found by looking at the data after the fact, not predicted in advance, which means the usual significance threshold needs a real haircut before it’s trustworthy. It’s being watched, not acted on as a filter.
Edge-inversion, on live picks specifically. A large historical backtest found that bigger claimed edges predicted worse results, not better — see the full analysis. On live picks specifically, the same relationship isn’t statistically detectable yet (n=165 is too small to expect it to be, even if the effect carries over) — an upper edge cap is running in shadow mode before being switched on.
Why report it this way instead of just the win rate
A track record that only shows the headline number is easy to build and easy to fake — see why we publish every loss. A track record that shows which specific claims have and haven’t cleared statistical significance yet is much harder to fake, because faking honest uncertainty defeats the purpose of faking in the first place. If every claim here were reported as settled and confident, that alone would be worth distrusting.
What would change this
If the CLV confidence interval crossed zero at a larger sample, or a segment split that currently looks promising failed to hold up as more data arrived, that would be published as a correction — not quietly dropped from future updates. “Not enough data yet” has already been the honest answer given for more than one specific claim in this same record, including a proposed model change that was tested, found not to beat the existing approach, and left unchanged as a result.
Related: is value betting actually profitable? covers the general version of the sample-size question this article answers with one specific, real dataset.
Frequently asked questions
- Is 244 picks enough to prove a betting model works?
- It's enough to start looking seriously, not enough to call it proven. Several individual claims — like specific surface or segment splits — still don't clear statistical significance at this sample size, and we say so explicitly rather than rounding a promising trend up to a settled conclusion.
- What's the actual record after 244 tracked picks?
- 203 settled (125 wins, 78 losses, 3 still open, plus 38 voided — no result to grade, stake refunded), a net result of +26.48 units, and an ROI of +13.0%. All figures as of September 6, 2026, and updated continuously on the results page.
- How does ServedBets know a losing week isn't a sign something's broken?
- By checking it against what pure variance would produce at the current win rate — one specific check found a 7-day stretch of 15 wins from 27 picks sits well within the range random chance alone produces about a third of the time, with a z-score nowhere near the threshold for concern.
- Why publish confidence intervals instead of just the headline numbers?
- Because a headline number with no uncertainty range invites treating early results as more settled than they are. A confidence interval that still includes zero on some individual claims is the honest state of the evidence — not a weaker way of saying the same thing.